Measuring AI Overview Traffic and ROI: The B2B Marketer's Practical Guide to Proving Citation Value
Measuring AI Overview Traffic and ROI explains how B2B marketers can isolate AI Overview citation appearances in Google Search Console, supplement that data with GA4 behavioural segmentation and CRM attribution, and translate the results into a pipeline value figure suitable for C-suite reporting. The article provides a calculation methodology for attributing commercial value to AI Overview visibility and a competitive context framework for making the investment case. It is aimed at CMOs and marketing directors at mid-market B2B companies seeking to quantify the business impact of AI search optimisation.
Why Measuring AI Overview Impact Is Now a Business-Critical Skill
The shift to AI Overviews is not gradual. John JB Russell, Director at Digital Womble, states the position directly: "Google AI Overviews are pulling 30 to 50% of organic traffic. If you're not optimised for them, you're losing half your potential visibility." For a CMO at a mid-market B2B company, that is not a trend to monitor at a distance. It is a revenue risk that requires a measurement framework capable of quantifying both the loss from missed citations and the gain from winning them.
If you are struggling to understand where to begin, you should score your site's search visibility to gain clarity on your current position. The challenge is that AI Overviews do not appear as a clean, separate traffic source in Google Analytics 4 by default. Most organisations are currently reporting organic traffic as a single blended channel, which obscures whether a session originated from a traditional blue-link click, an AI Overview citation, or a featured snippet. Without that distinction, you cannot make a credible case for investment in AI overview optimisation, and you cannot demonstrate the ROI of content work that wins citations. How agencies are upselling topical authority can help you structure your services to prove this value.
Building a measurement framework for AI Overview impact requires work across three tools: Google Search Console for impression and click data at the query level, Google Analytics 4 for behavioural and conversion data, and your CRM for pipeline attribution. None of these tools provides a complete picture on its own. Used together, with deliberate tagging and segmentation strategies, they can produce a reasonably accurate view of the commercial value of your AI Overview presence. The complete guide to AI overview optimization covers the strategic context for this measurement work.
How to Isolate AI Overview Traffic in Google Search Console
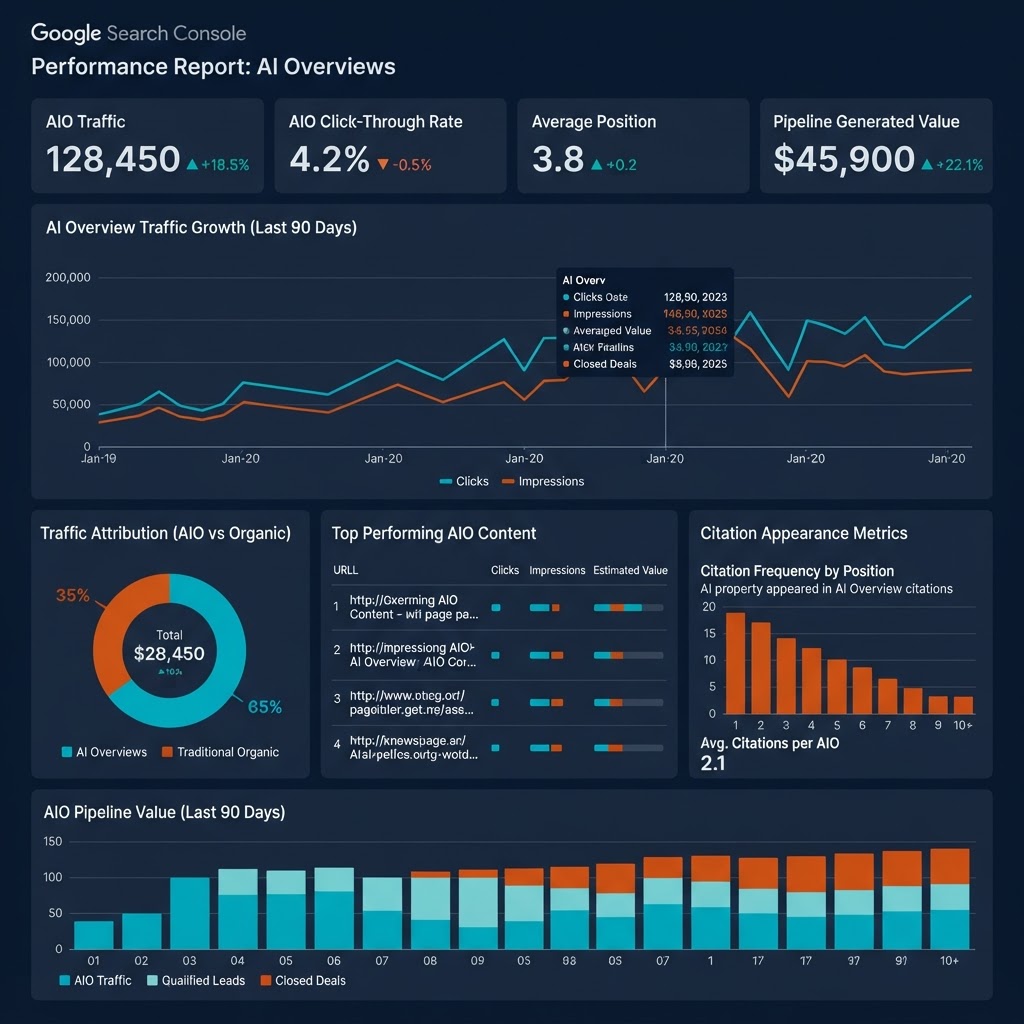
Google Search Console is the starting point for any AI Overview measurement exercise. As of 2024 and into 2025, Google has introduced a Search Appearance filter within the Performance report that includes an "AI Overviews" segment. To access it, navigate to the Performance section, select Search Type as Web, then apply the Search Appearance filter and select AI Overviews. This will display the impressions, clicks, click-through rate, and average position for queries where your content appeared within an AI Overview.
If your site is struggling to appear in these results entirely, you may want to use a free Google index checker to verify that your pages are being properly crawled. The data you will see here requires careful interpretation. Impressions in the AI Overview context mean that your content was cited or referenced within an AI Overview response for that query. Clicks represent users who clicked through from the AI Overview citation to your page. The click-through rate for AI Overview citations is typically lower than for traditional blue-link results, because the AI Overview itself answers part of the query before the user decides whether to visit your page. However, the intent quality of users who do click through tends to be higher, because they have already received context and are clicking for depth rather than a quick answer. Topical authority metrics can help you understand how to monitor these shifts in search behaviour.
Export the filtered data into a spreadsheet and segment by query type: branded queries, category queries, and product or solution queries. This segmentation reveals where your AI Overview appearances are concentrated and where gaps exist. Cross-reference this with your traditional ranking data for the same queries to identify cases where you rank well organically but are absent from the AI Overview, or conversely where you appear in the AI Overview despite not ranking prominently in traditional results. Both patterns are commercially significant and should inform your content priorities.
Supplementing Search Console Data with GA4 and CRM Attribution
Google Search Console provides query-level data but cannot tell you what users did after arriving on your site from an AI Overview click. For that, you need Google Analytics 4. The challenge is that GA4 does not natively distinguish AI Overview clicks from other organic clicks without additional configuration. The most reliable approach is to use UTM parameters appended to the URLs that appear in AI Overviews, but since you do not control the URLs that Google includes in citations, this requires a different strategy.
Instead, use GA4's landing page report segmented by organic traffic to identify the specific pages that Search Console confirms are receiving AI Overview clicks. Create a custom segment in GA4 that includes sessions where the landing page matches any URL confirmed as an AI Overview recipient in your Search Console data. This allows you to compare the behavioural metrics of AI Overview-driven sessions against standard organic sessions: average session duration, pages per session, goal completion rates, and conversion events. In most B2B contexts, AI Overview-driven sessions show higher engagement metrics, which strengthens the case for continued investment. Internal linking strategy for content clusters is essential for ensuring your cited pages pass authority to the rest of your site.
For pipeline attribution, export the list of AI Overview landing pages and cross-reference against your CRM records for leads that entered via those pages during the measurement period. Most B2B CRMs capture the first-touch landing page or referral source for each contact record. Filter for contacts whose first-touch page matches your AI Overview pages and calculate the aggregate pipeline value generated by those contacts. This is not a perfect attribution model, but it is a credible proxy that CMOs can use to quantify the commercial value of AI Overview visibility. For further detail on the content investments that drive AI Overview appearances, review our article on multi-source attribution in AI search.
Calculating the Pipeline Value of AI Overview Citation Appearances
To calculate the pipeline value of AI Overview citations, you need four inputs: the number of clicks attributable to AI Overview appearances in a given period, the conversion rate from organic landing page visits to qualified leads for those specific pages, your average deal value, and your historical lead-to-close rate. The calculation is straightforward: multiply AI Overview clicks by the landing page conversion rate to get attributed leads. Multiply attributed leads by your lead-to-close rate to get attributed deals. Multiply attributed deals by average deal value to get attributed revenue.
For most mid-market B2B companies, the numbers will initially look modest, because AI Overviews are still a relatively new traffic source and citation volumes are building. The more useful metric in the near term is the trend: is the number of queries where your content appears in AI Overviews growing month on month? Is the click volume from those appearances increasing? Is the conversion rate from AI Overview sessions higher or lower than from traditional organic sessions? These trend metrics make a stronger case for sustained investment than a single-period revenue number, particularly when AI Overview traffic is still at an early stage relative to traditional organic.
One useful benchmark exercise is to calculate the cost of acquiring equivalent visibility through paid search. Identify the queries where your AI Overview citations appear and look up the average CPC for those queries in Google Ads Keyword Planner. Multiply the number of AI Overview clicks you received by the average CPC to generate an equivalent paid search value. This figure, the cost you would have incurred to generate the same click volume through paid advertising, is a defensible proxy for the value of your AI Overview presence and a compelling number to include in a C-suite measurement report.
Reporting AI Overview ROI to the C-Suite
Reporting AI Overview performance to a CMO or CEO requires translating technical search metrics into commercial language. A slide that shows impression growth in Google Search Console is not a business case. A slide that shows £180,000 in attributed pipeline from AI Overview citations, growing at 23% month on month, against a content investment of £12,000, is a business case. The framing matters as much as the data. Fractional CMO pricing model insights can help when you are presenting these revenue models to clients or executives.
Structure your AI Overview ROI report around four sections: visibility (how many queries we appear in and how that has changed), traffic (how many clicks we received and their behavioural quality), pipeline (what commercial value can be attributed to those sessions), and investment efficiency (how the cost per attributed lead from AI Overviews compares to other acquisition channels). Keep each section to one or two key metrics. Avoid presenting raw Search Console data to an executive audience without contextualisation. They need to understand what the numbers mean for the business, not how to use the tool. If you are struggling to interpret your performance, a traffic quality audit can help you identify these gaps.
The most persuasive element of any AI Overview ROI report is competitive context. Use tools such as Semrush, Ahrefs, or dedicated AI Overview tracking tools to identify which competitor pages are appearing in AI Overviews for your target queries. If a competitor is consistently cited where you are absent, quantify the estimated traffic they are receiving using published click-through rate benchmarks and their estimated organic traffic volumes. The gap between their AI Overview presence and yours, expressed in traffic and pipeline terms, is the most urgent argument for investment in measuring AI Overview traffic and ROI systematically. To build the content foundation that drives those citations, the technical audit covered in our Google AI Overview SEO technical checklist is the right starting point.
Key Takeaways
- Google Search Console's Search Appearance filter now includes an AI Overviews segment that shows impressions and clicks from citation appearances.
- AI Overview sessions typically show higher engagement metrics than standard organic sessions, supporting the commercial case for citation investment.
- Calculating the equivalent paid search cost of AI Overview click volume provides a defensible proxy ROI metric for C-suite reporting.
People Also Ask
How do I see AI Overview traffic in Google Search Console?
Can I track clicks from Google AI Overview citations in Google Analytics 4?
How do I calculate the ROI of appearing in Google AI Overviews?
What metrics should I report for AI Overview performance to the C-suite?
FAQ
How do I find AI Overview traffic data in Google Search Console?
In Google Search Console, go to the Performance report, set Search Type to Web, then apply the Search Appearance filter and select AI Overviews. This displays impressions, clicks, click-through rate, and average position for queries where your content appeared in an AI Overview.
How do I attribute pipeline value to Google AI Overview citations?
Multiply AI Overview-attributed clicks by your landing page conversion rate to get attributed leads. Multiply attributed leads by your lead-to-close rate and then by average deal value to produce an attributed revenue figure. Cross-reference AI Overview landing pages with CRM first-touch records to validate the attribution.
Is the click-through rate from AI Overview citations higher or lower than traditional organic results?
The click-through rate from AI Overview citations is typically lower than from traditional blue-link results, because the AI Overview partially answers the query before users decide to click through. However, users who do click through tend to show higher engagement metrics, suggesting stronger intent.
What is the easiest way to express AI Overview ROI in terms the C-suite will understand?
Calculate the equivalent cost of acquiring the same click volume through Google Ads paid search, using average CPC data from Keyword Planner for the queries where your AI Overview citations appear. This equivalent paid search value provides a commercially credible proxy for the financial value of your AI Overview presence.
Key Answer
To measure AI Overview traffic and ROI, apply the AI Overviews filter in Google Search Console's Performance report to see impressions and clicks from citation appearances. Supplement this with GA4 behavioural data by segmenting sessions landing on AI Overview-cited pages. Attribute pipeline value by cross-referencing those landing pages with CRM first-touch data and calculating attributed leads, close rates, and revenue. Compare the cost of equivalent paid search clicks to express AI Overview value in commercial terms.